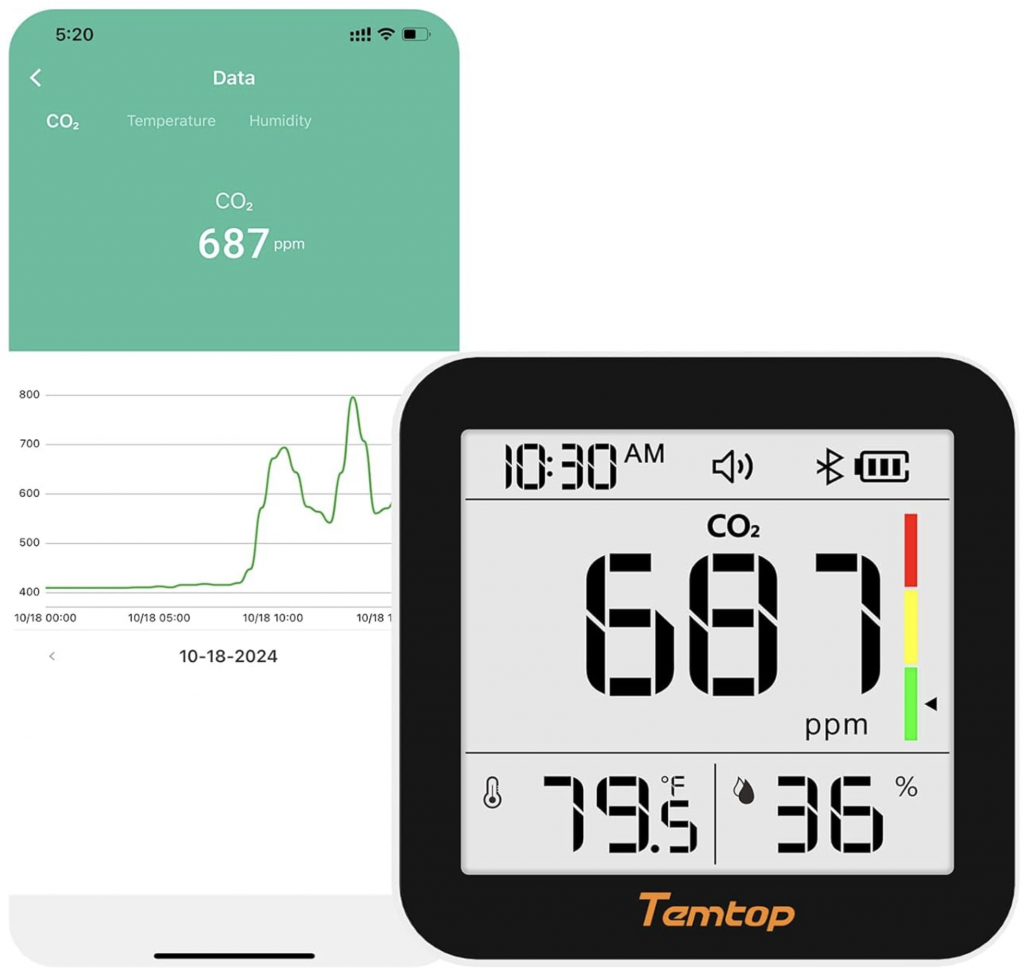
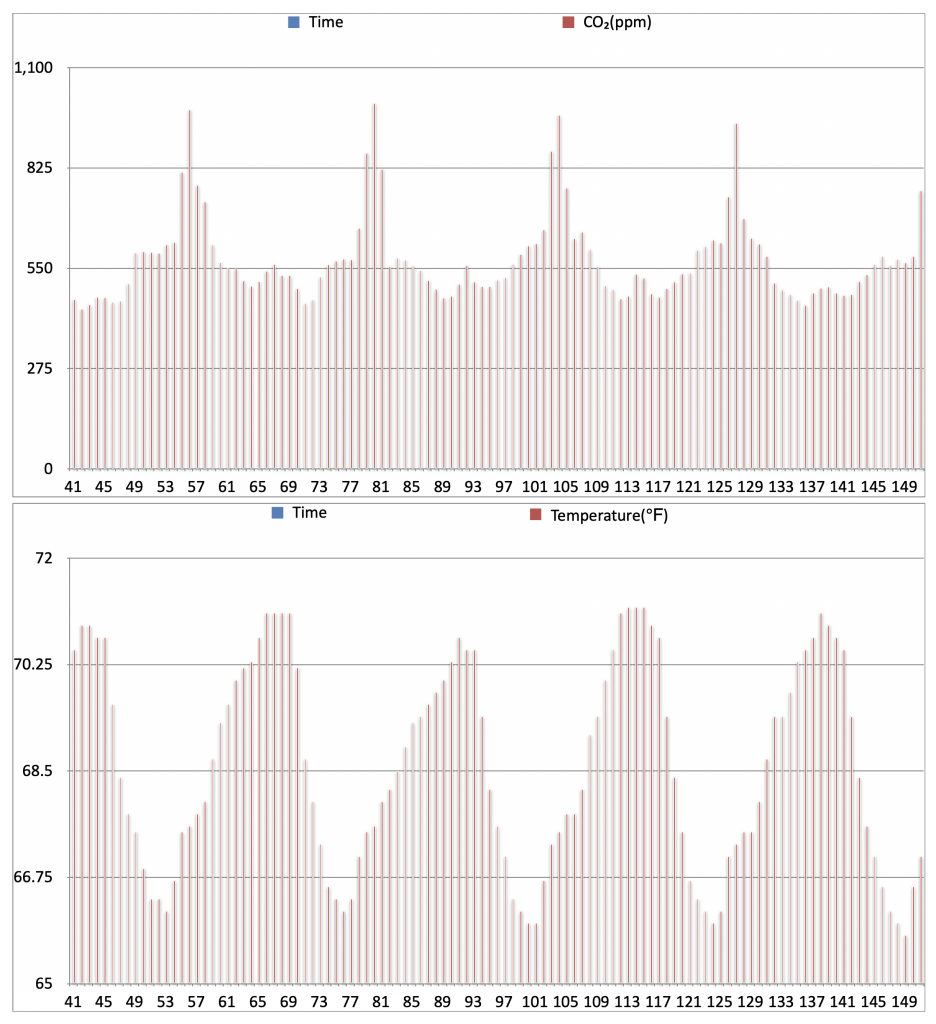
I recently purchased a device that monitors and records carbon dioxide, temperature, and humidity levels. I am using it to improve air quality and comfort in our home. The top chart shows CO2 levels measured hourly over five days in our bedroom, while the bottom chart displays temperature. The CO2 pattern peaks every morning at 7 AM, driven by our respiration in the closed room. Optimal levels of CO2 are in the range of 400-800 ppm. Based on this information, I have programmed our ventilation system to increase fresh air from 5 AM to 7 AM. The reason for not leaving the system turned up all day is that it wastes energy. I will remeasure CO2 levels over the next week and refine the ventilation schedule as needed.
The temperature chart reflects the summertime programming of our HVAC system during a week with outdoor temps in the 90s. The AC starts running at 8 PM and cools the house to 66°F by bedtime (our optimal sleeping temperature). At 4 AM, it turns off, and the temperature ramps up to 71°F over the next 12 hours or so.
NERD ALERT: When I get some time, I will use this data to see how accurate my HVAC design calculations were.